Review the largest contentful paint details
Review the lab metrics alongside the page being tested. Compare the reported largest contentful paint, total blocking time, cumulative layout shift with the page or domain you intended to check.
Review Lighthouse lab metrics and available real-user Core Web Vitals for a URL. Use the results to investigate slow loading and layout shifts.
Start PageSpeed Checker ↗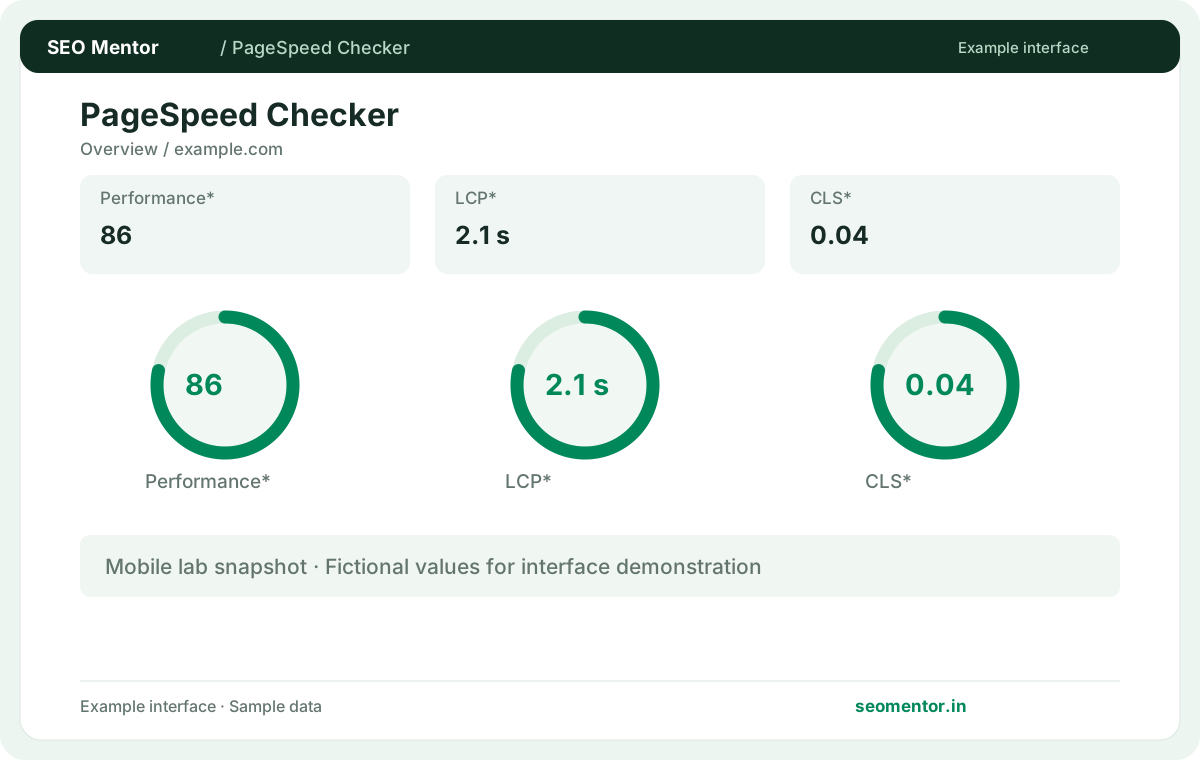
Enter the relevant information to review the available result and any applicable report options.
Separate lab observations from field data; some URLs have insufficient real-user samples. Start with the questions your audience actually asks.
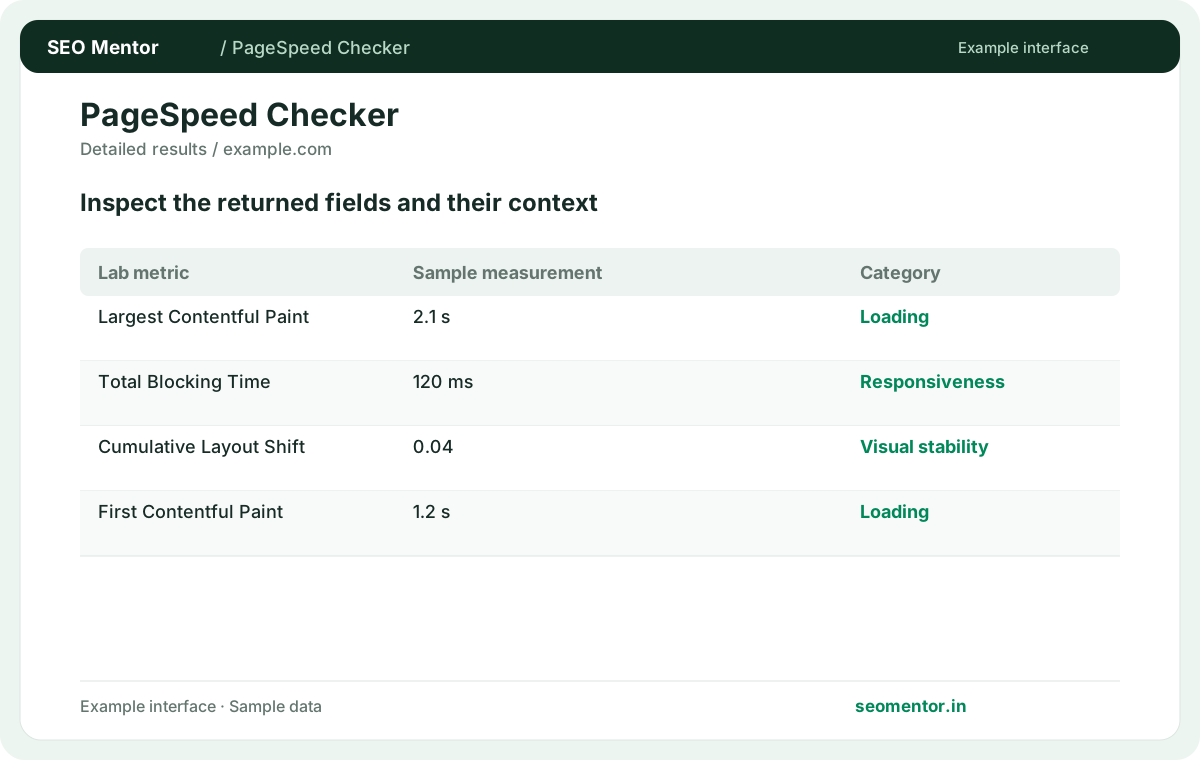
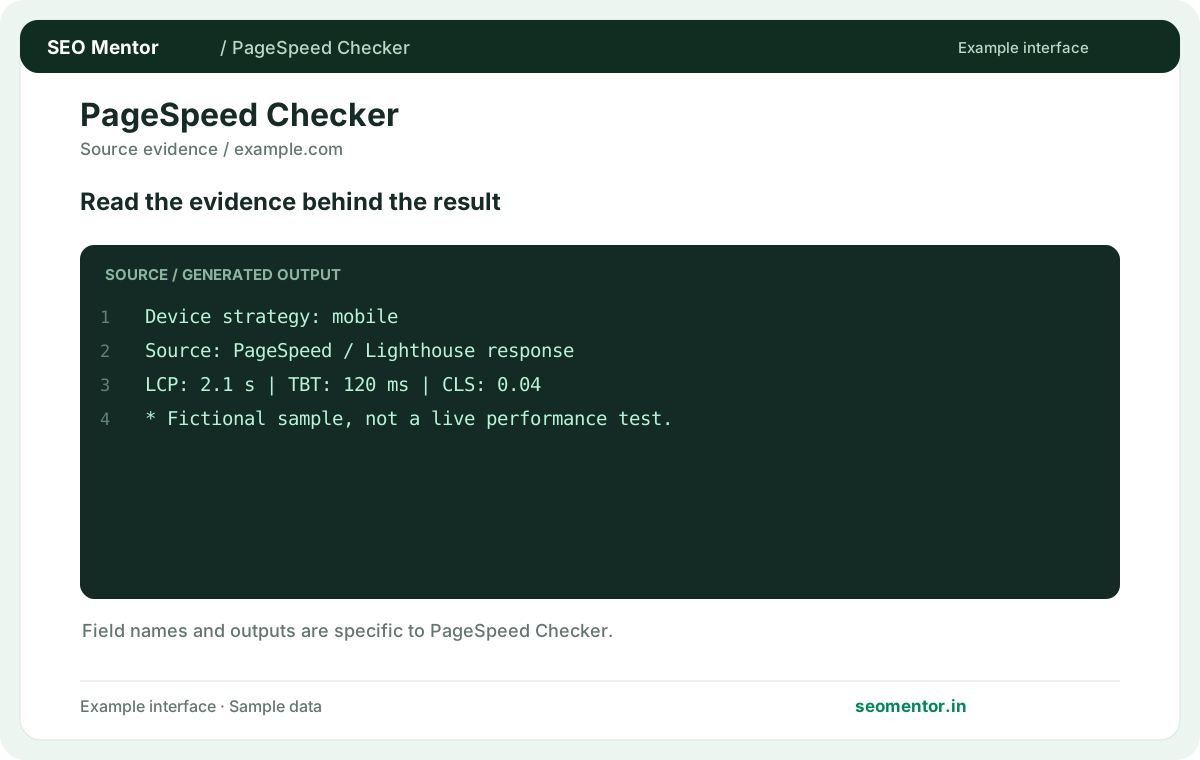
Compare largest contentful paint, interaction to next paint, cumulative layout shift in context before deciding what to change.
Record what the report actually shows, compare relevant pages and validate findings before publishing changes.
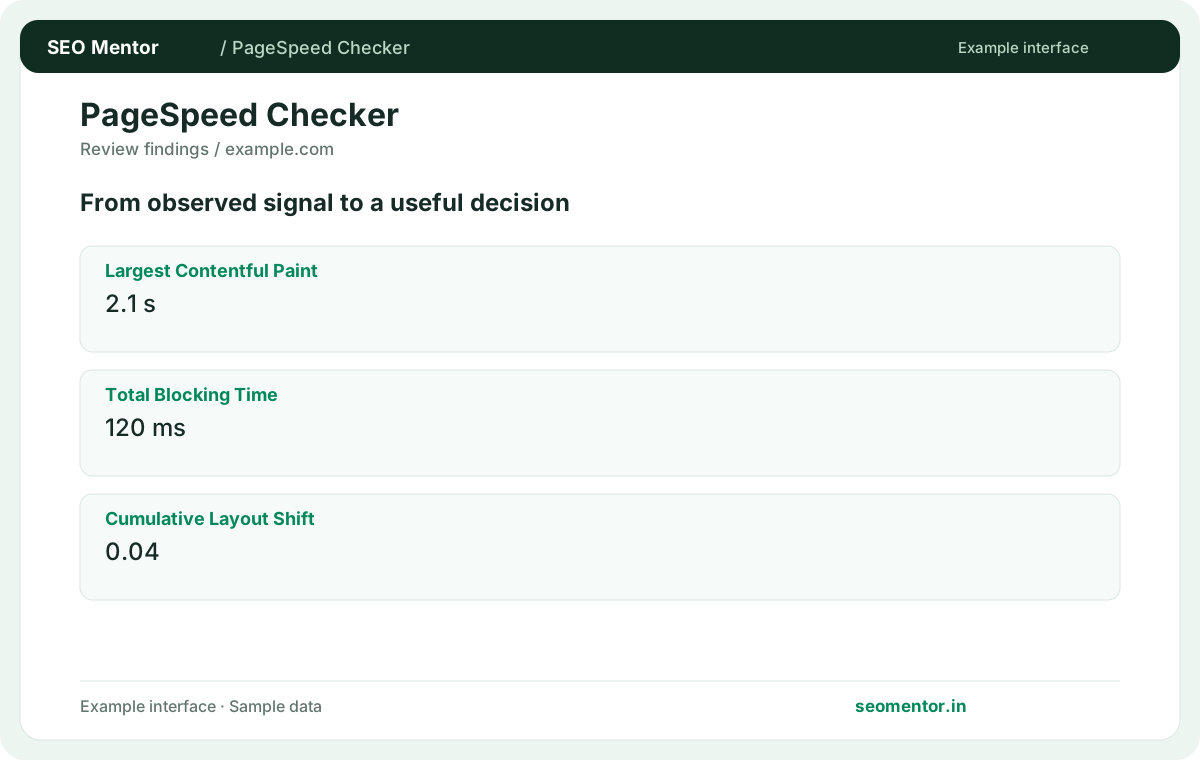
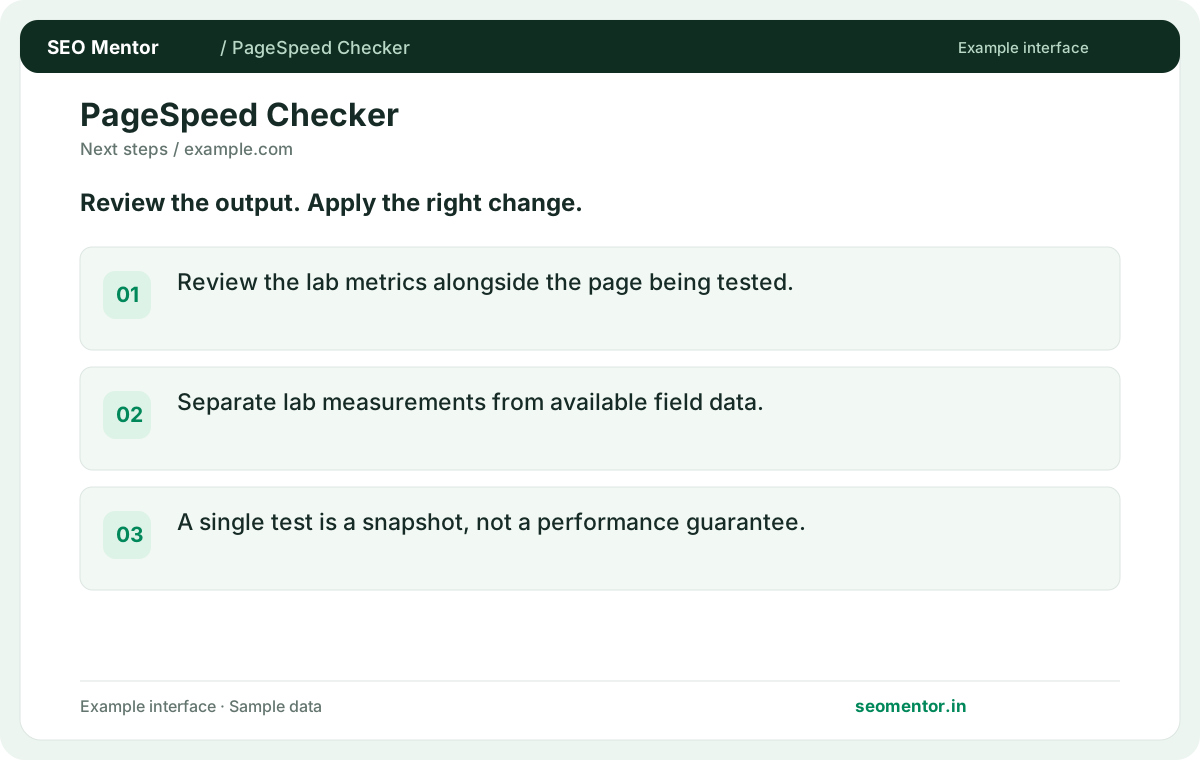
Separate lab observations from field data; some URLs have insufficient real-user samples. Recheck after substantive updates rather than relying on sample illustrations.
Review the performance of pages that customers use to browse services, view products and send enquiries. Separate lab measurements from any available field data before deciding which loading or layout issue to address.
Review the lab metrics alongside the page being tested. Compare the reported largest contentful paint, total blocking time, cumulative layout shift with the page or domain you intended to check.
Separate lab measurements from available field data. A single test is a snapshot, not a performance guarantee.
Keep the result alongside the page or domain reviewed, so you can compare the evidence after making changes.
It comes from a controlled test run. Use its diagnostics to identify work worth investigating.
Related check — Can server caching improve response time? Cached responses can reduce origin work. Verify hits and misses separately on pages that can safely be cached.
It reflects available real-user measurements over time. Low-traffic URLs may lack page-level field data.
Related check — Why might a report show an origin result? Field measurements may be available for the site as a whole. Confirm the scope before attributing them to a single URL.
Network, device simulation and server load vary. Compare several runs under the same settings.
Related check — How do I compare before and after optimisation? Use the same URL and strategy. Record multiple samples and compare individual metrics rather than the score alone.
It tracks when the largest eligible visible content element renders. Identify that element before changing image or font loading.
If the LCP element is a large hero photo, inspect its transfer size and when the browser starts loading it. Compare a compressed responsive image against the current one using the same test strategy before attributing the result to the optimisation.
Images, embeds and late content can move visible elements. Reserve space and retest the affected template.
Related check — What does LCP measure? If the LCP element is a large hero photo, inspect its transfer size and when the browser starts loading it. Compare a compressed responsive image against the current one using the same test strategy before attributing the result to the optimisation.
Review interaction metrics where available and inspect long tasks. Test representative user actions on mobile devices.
Related check — Why do mobile and desktop scores differ? The tests use different environments. Prioritise the experience of devices your visitors actually use.
The tests use different environments. Prioritise the experience of devices your visitors actually use.
Related check — How should I investigate slow interactions? Review interaction metrics where available and inspect long tasks. Test representative user actions on mobile devices.
Cached responses can reduce origin work. Verify hits and misses separately on pages that can safely be cached.
Related check — What is Lighthouse lab data? It comes from a controlled test run. Use its diagnostics to identify work worth investigating.
Use the same URL and strategy. Record multiple samples and compare individual metrics rather than the score alone.
Related check — Why does the performance score fluctuate? Network, device simulation and server load vary. Compare several runs under the same settings.
Field measurements may be available for the site as a whole. Confirm the scope before attributing them to a single URL.
Related check — What is field data? It reflects available real-user measurements over time. Low-traffic URLs may lack page-level field data.
SEO Mentor helps you identify opportunities. SEOKart can help put those findings into action with professional SEO services, technical improvements and ongoing optimisation.
Explore SEOKart SEO Services